Why the dashboard matters
The Clean Energy Solutions Index dashboard was developed to make CESI 2025 easier to use in practice.
The Index contains a rich set of findings on how Australians feel about 11 clean energy solutions. But the value of that data increases when people can explore it for themselves, compare results across audiences, and pull out the patterns most relevant to their work.
That is what the dashboard is designed to do.
Rather than stopping at a national headline number, users can move through the data by solution, state and audience segment. They can look at support levels, compare barriers and drivers, and see where support appears deeper, more tentative or more uneven.
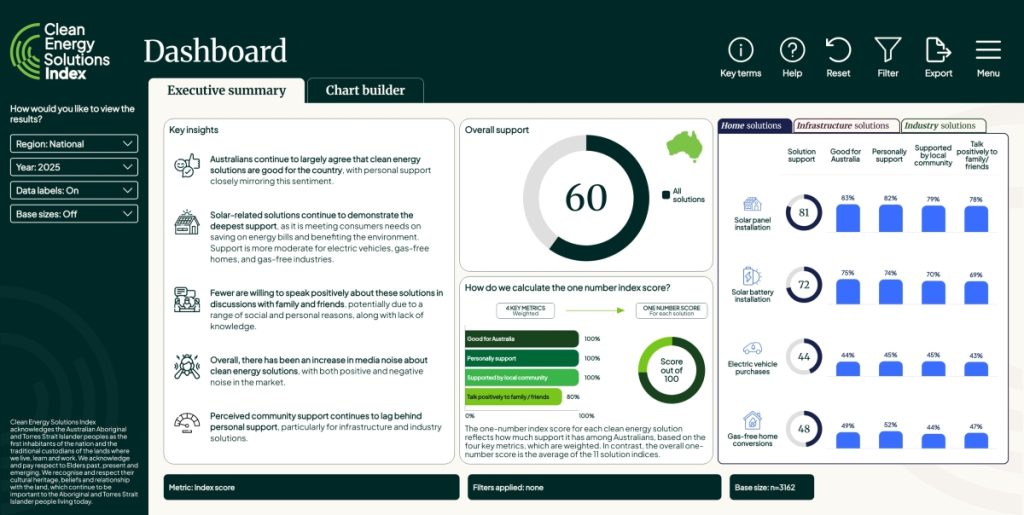
That matters because CESI measures more than simple approval. The one-number support score combines four indicators of deep support: personal support, whether a solution is seen as good for Australia, whether people think their local community supports it, and whether they would speak positively about it with family and friends.
The real benefits of the Clean Energy Solutions Index dashboard
The dashboard helps bring those layers to life and allows users to delve into the topics and audiences that most matter to them (but didn’t make it into our summary report).
- For example, users can ask:
- Do regional Australians show higher or lower deep support for solar panels? (Regional Australians recorded a one-number support score of 83 for home solar panels, which was 4 points higher than metropolitan Australians.)
- Which age group recorded the highest overall one-number support score? (Australians aged 25 to 34 recorded the highest score at 63.)
- Who is more likely to say climate change is very important to them personally, men or women? (46% of women said it was very important, compared with 40% of men.)
- Do renters and homeowners differ greatly in their overall deep support? (In overall terms, they did not. Both homeowners and renters recorded a one-number support score of 60.)
These are the kinds of insights the dashboard was built to unlock.
It is a public tool designed to help people test assumptions, understand where support is strongest, and identify where clearer communication or engagement may still be needed.
Built for practical use
The dashboard was built for people who need to use public sentiment data, not just read about it.
For policymakers and government agencies, it can help identify where support is already well established and where community perceptions may be lagging. For industry and project developers, it can help point to the barriers that matter most, whether that is upfront cost, unfamiliarity, concern about impacts on nature, or uncertainty about practical benefits. For advocates, communicators and researchers, it offers a way to test assumptions, compare audiences and ground commentary in a fuller set of evidence.
Just as importantly, the dashboard is public. It allows more people to work from the same evidence base, ask better questions of the data, and build a more informed discussion about the clean energy transition.
Conclusion
CESI was designed to measure deep support, not just surface agreement. The dashboard extends that purpose by making the data easier to interrogate, compare and apply.
A national support score is useful. But the details behind it are often where the most valuable insight sits. The dashboard helps surface those details and makes it easier for users to move from a headline number to a clearer understanding of what Australians supported, what held support back, and where the strongest opportunities for engagement may lie.
The Index contains a rich set of findings on how Australians feel about 11 clean energy solutions. But the value of that data increases when people can explore it for themselves, compare results across audiences, and pull out the patterns most relevant to their work.
Source note:
Findings are based on the Clean Energy Solutions Index 2025,
The Clean Energy Solutions Index was developed by 89 Degrees East in collaboration with Boundless.
Relevant data points used here include the national support score, solution-level support scores, and key drivers and barriers for home solar and home batteries.