
The Index has been designed to provide decision-makers with the evidence they need to accelerate Australia’s transition.
By measuring deep support, the Index seeks to provide a reliable, trackable evidence-base for leaders across government, industry and advocacy.
Understanding how Australians really feel about specific technologies enables strategies to build and sustain momentum towards a clean energy future.

Please click each heading below to see more info.

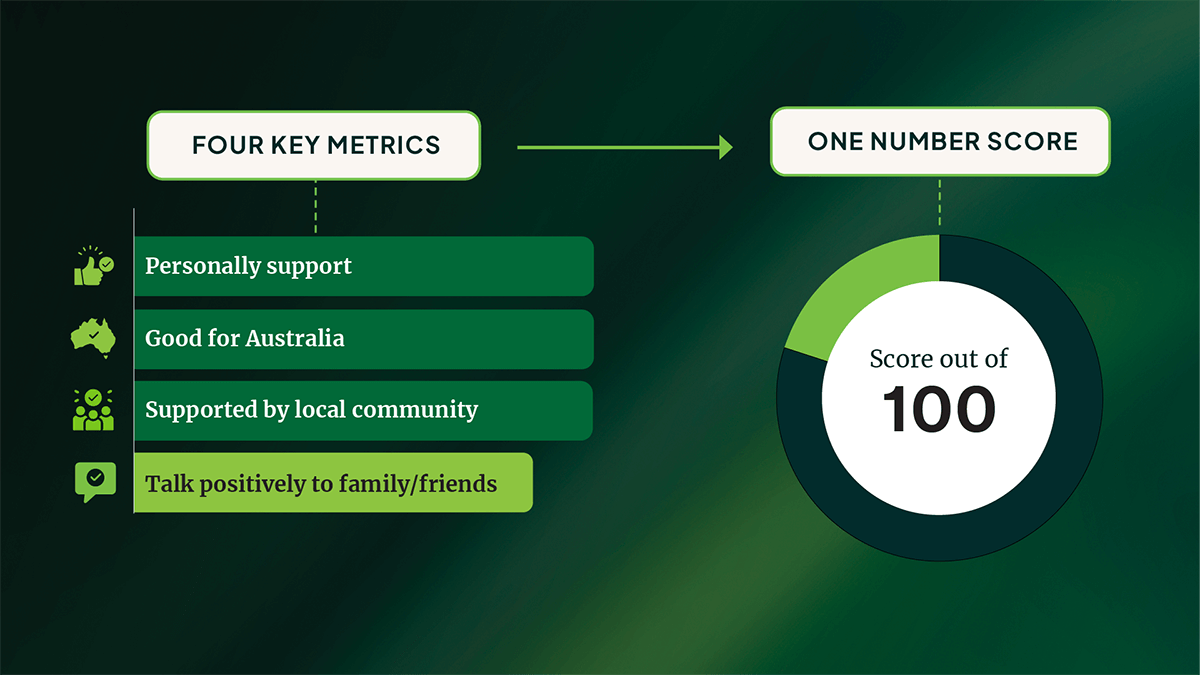
While there is a wealth of data about how Australians feel about clean energy, the Index defines and measures deep support for those solutions through a one-number support score.
Deep support is determined by four key metrics:

Along with questions relevant to the 4 key metrics, additional data is collected to provide greater insight into the support scores, including drivers and barriers to support.
These questions include attitudes to various technologies, such as personal adoption.
By identifying both the drivers and barriers to support, it enables targeted, data-driven strategies to build and maintain social licence.
– Clean Energy Solutions Index 2025 Report
The Support Score indicates the level of deep public support for each individual clean energy solution through a single composite number.
In addition, the National and State Scores reflect the overall level of deep support for clean energy solutions.
Together, these measures offer a comprehensive view of how Australians back the transition to clean energy at the solution, national and state levels.

The measures of deep support for a specific clean energy solution is shown through the Support Score. The Support Score is a composite of the 4 key metrics: personal support, national benefit, perceived community support and willingness to advocate.
The overall level of public support for clean energy solutions across the whole of Australia is indicated by the National Score. It is the average of all 11 clean energy solution support scores nationally.
The level of public support for a clean energy solution within a specific state is illustrated through the State Score. It is the average of all 11 clean energy support scores within that state.
By understanding how the Index is built, you can have confidence in the quality, reliability and relevance of the findings.

A survey collects the data needed to create the one-number support score for each solution.
This survey includes questions relevant to the 4 key metrics which make up the Index, as well as non-Index questions.
The order of solutions is randomised in the survey to avoid any potential order bias.
The Index metrics were developed through extensive consultation including interviews and expert analysis of previous studies.
A benchmark survey was conducted in late 2024 to test and validate both the Index metrics and the weighting applied.
Along with questions needed to compile the one-number support scores, the survey includes questions that provide greater insights, including drivers and barriers to support.
These questions include attitudes to various technologies, such as personal adoption.
Understanding these terms will help you utilise the Index.
Energy generated from renewable, low- or zero-emissions sources such as solar, wind and hydro. Clean energy reduces greenhouse gas emissions and helps Australia transition to a net zero economy.
The 11 clean energy technologies, projects or approaches measured by the Index. The solutions measured in the Index are all renewable, representing practical pathways for Australia to transition away from high-emissions sources. They were selected following extensive consultation with government, industry and experts.
A measure of overall support for a specific clean energy solution. The one-number support score is calculated using the Index’s four metrics, which have been carefully selected to capture “deep support”.
The overall level of public support for clean energy solutions across the whole of Australia. It is the average of all 11 clean energy solution support scores nationally.
The level of public support for a clean energy solution within a specific state or territory. It is the average of all 11 clean energy solution support scores within that state. State Scores help identify regional differences in attitudes towards clean energy.
A nationally representative poll of Australians, conducted annually, to generate the one-number support score for each solution. The survey includes Index questions and non-Index questions. Index questions are asked of each clean energy solution to calculate the support score according to the methodology.
The four key index data points used to calculate the depth of public support for each clean energy solution. These metrics have been developed to look beyond whether people simply ‘support’ a solution to understand how strongly they feel, and what barriers exist.
Additional survey questions and data points collected alongside the core Index metrics. These may include awareness levels, positive or negative noise or willingness to adopt a solution. While not used in calculating support scores, non-Index metrics provide valuable context to help interpret results and identify engagement opportunities.
The relative importance given to each metric when calculating the Support Score. Some metrics may be given greater influence in the calculation to reflect their significance in building strong social licence.
The strength and stability of public backing for a specific clean energy solution, measured through four key metrics: personal support, belief it benefits Australia, perception of local community support, and willingness to advocate for it. Measuring deep support provides a more stable and nuanced view of public sentiment than surface-level polling.
Factors identified in the Index data that may prevent or slow the adoption of a clean energy solution. These may include cost concerns, lack of information, perceived risks, uncertainty or local opposition. Barriers help decision-makers understand what must be addressed to build stronger social licence.
Insights from the Index data that reveal where and how support for a clean energy solution can be strengthened. Opportunities might include high existing support in certain regions, strong alignment with community values or potential for targeted engagement to shift neutral or undecided attitudes.
The ongoing acceptance and approval of a project, policy, clean energy solution or industry by the community and stakeholders it affects. It is built on trust, transparency and mutual benefit, and is essential for maintaining public support over time.
As with any index, the metrics used to calculate the support scores are weighted to reflect the relative significance of each metric.
In the Clean Energy Solutions Index, each of the 4 key metrics is weighted equally, except for the metric about willingness to advocate.
This metric is down-weighted at 85% of the others to reflect Australians’ reticence to talk about topics that are perceived to require expert knowledge and appear to be politically divisive.
Therefore, some metrics have been given greater influence in the calculation to reflect their significance in building strong social licence.
The 2025 Index reveals widespread support for clean energy across Australia.